
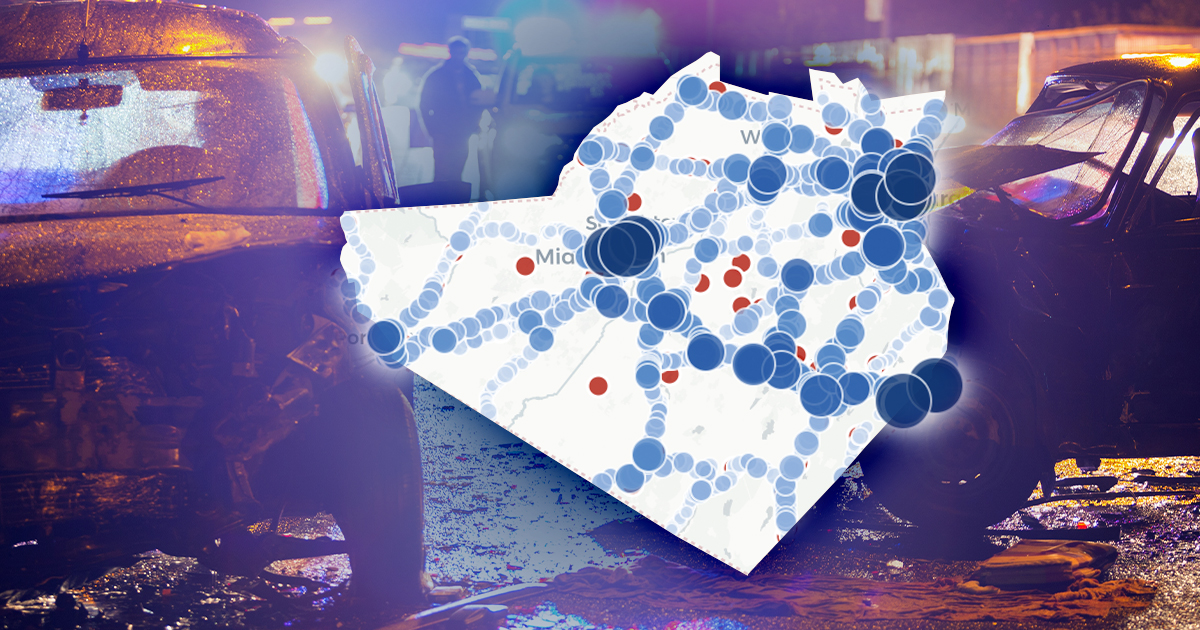
We analyzed every reported motor vehicle crash in Orange County from 2021 through 2024 — 44,784 crashes, the most of any Hudson Valley county — using New York State’s official crash records. Unlike our regional highway map, these county-wide figures cover every road: state highways, the Thruway, and county, town, and city streets.
Nearly seven people are injured on Orange County roads every day
Orange County averaged 2,446 injury crashes per year over the last four years — close to seven injury crashes every single day, nearly as many as Ulster and Dutchess combined. Injury crashes rose 15.5% from 2021 to 2024, the steepest increase of the three counties.
| Year | Total crashes | Injury crashes | Fatal crashes | Injury rate |
|---|---|---|---|---|
| 2021 | 9,523 | 2,244 | 29 | 23.6% |
| 2022 | 11,687 | 2,439 | 38 | 20.9% |
| 2023 | 11,597 | 2,509 | 27 | 21.6% |
| 2024 | 11,977 | 2,592 | 38 | 21.6% |
2024 set the record for both total crashes (11,977) and injury crashes (2,592). More than one in five crashes here injures someone.
How Orange compares to its neighbors
| County | Injury crashes/yr | Fatal crashes/yr | Injury rate |
|---|---|---|---|
| Orange | 2,446 | 33 | 21.8% |
| Dutchess | 1,580 | 26 | 21.4% |
| Ulster | 894 | 15–16 | 17.9% |
Orange County carries the Hudson Valley’s heaviest traffic — I-84, I-87, Routes 17, 9W, and 32 all converge here — and its crash totals show it.
The crashes that injure people here
Among crashes with an identified collision type (2021–2024):
| Collision type | Crashes | Why it matters |
|---|---|---|
| Rear-end | 9,125 | The runaway leader — following too closely and distracted driving on congested corridors |
| Overtaking | 5,639 | Passing maneuvers — Orange’s #2, reflecting its mix of highways and two-lane routes |
| Right angle | 4,476 | Intersection crashes — someone ran a light or stop sign |
| Left turn | 1,777 | Turning across oncoming traffic |
| Head-on | 723 | The rarest of the major types — and the most severe |
Rear-end and right-angle crashes are the collision types where fault is usually clear — and where injured people have the strongest claims. If you’ve been hit in Newburgh, Middletown, or anywhere in Orange County, our Newburgh injury attorneys can tell you quickly whether you have a case.
The roads where Orange County crashes happen
Geocoding every state-highway crash to its exact location shows where Orange County’s problem actually lives. Route 17 is the county’s busiest crash corridor, but the injury pattern tells a different story: US 9W produced 540 injury crashes on far less volume, and US 6 — the mountain road to the Bear Mountain Bridge — is the county’s deadliest, with 14 fatal crashes on all its segments, more than any other road in the county.
| Corridor | Crashes (2021–24) | Injury | Fatal |
|---|---|---|---|
| NY 17 | 2,897 | 587 | 11 |
| I-84 | 2,304 | 404 | 13 |
| US 6 | 2,034 | 478 | 12 |
| US 9W | 1,900 | 540 | 6 |
| NY 32 | 1,378 | 355 | 5 |
| NY 211 | 1,375 | 331 | 6 |
| NY 17K | 1,324 | 367 | 6 |
| NY 17M | 1,238 | 277 | 1 |
Zoom in further and the crashes cluster at specific spots — and two of the region’s four worst locations are Orange County traffic circles:
- Long Mountain Circle (US 6, Highlands) — 141 crashes, including 2 fatal. The second-worst location in the entire Hudson Valley.
- Bear Mountain Circle (US 6/9W, Highlands) — 112 crashes, plus 81 more at a second approach point.
- NY 211 near Dunning Road (Wallkill, the Middletown commercial strip) — 111 crashes, 24 injury crashes, the county’s worst non-circle location.
- US 9W at NY 32 (North Plank Road), Newburgh — 89 crashes, 20 injury.
- NY 211 at Fairlawn Avenue, Middletown — 83 crashes, 21 injury.
- NY 17K in Newburgh — one location with 76 crashes and 25 injury crashes, the most injuries of any 17K location.
The Newburgh area carries more state-highway crashes than any other Orange County municipality — 4,589 over four years, nearly double second-place Wallkill (2,459). And on top of the highway data, federal records count 123 fatal crashes (131 deaths) on Orange County roads of every type in 2021–2024 — including 5 on the Thruway, which state location data can’t see. Explore every location on our regional dangerous-highways map, or filtered to Orange County below.
When crashes happen in Orange County
- 65% of crashes happen in daylight — distraction, not darkness, drives the numbers.
- 18% happen on dark, unlighted roads — the highest share of the three counties.
- Friday is the most dangerous day (7,449 crashes over four years); Sunday is the safest (5,518).
Pedestrians and cyclists: 158 crashes a year — the region’s most
Orange County averaged 158 pedestrian or bicyclist crashes per year, the most of any county in the region (Dutchess averaged 124, Ulster 71). The most common scenario by far: crossing without a signal or crosswalk (186 over four years), followed by walking or riding along the highway with traffic (82).
What most people don’t know: New York’s no-fault insurance covers pedestrians and cyclists hit by a vehicle — the driver’s insurance pays your medical bills and lost wages even before fault is decided. Our Newburgh pedestrian accident lawyers handle these cases regularly.
What to do after a crash in Orange County
- Call 911 and get the police report number.
- Get medical attention the same day — no-fault benefits require prompt treatment records.
- Photograph vehicles, road conditions, and lighting before anything moves.
- Don’t give a recorded statement to the other driver’s insurer.
- Talk to a local lawyer before accepting any offer. Free consultation: 845-600-0000.
Mainetti & Mainetti in Orange County
The firm serves Newburgh, Middletown, and all of Orange County from its New Windsor office at 575 Hudson Valley Avenue. See our verdicts and settlements for what results have looked like across the Hudson Valley, and for a deeper look at how injury cases actually move through the county’s courts, see what Orange County court records show.
Frequently asked questions
How many car accidents happen in Orange County NY each year?
About 11,200 reported crashes per year — the most of any Hudson Valley county — roughly 2,446 of which injure someone (2021–2024 average, NY State crash records).
What’s the most dangerous road in Orange County?
By total crashes, Route 17 (2,897 over four years). By deaths, US 6 — 14 fatal crashes across its segments, more than any other road in the county.
What’s the most common type of car accident in Orange County?
Rear-end collisions — 9,125 over the last four years, far more than any other identified type.
Is Orange County getting more dangerous for drivers?
The data says yes: injury crashes rose 15.5% from 2021 to 2024, the steepest increase in the region, and 2024 set records for both total and injury crashes.
If you or someone you love was injured in a crash anywhere in Orange County, call 845-600-0000 for a free consultation at our New Windsor office. No fee unless we win.
Sources: New York State Open Data, “Motor Vehicle Crashes — Case Information” (2021–2024) and NHTSA FARS fatal-crash census, our own analysis. County-wide figures cover all roads; corridor and location figures cover state highways (New York publishes no location data for local roads); fatal-crash road counts cover all roads via federal records. Figures describe reported crashes and make no claim about fault.