
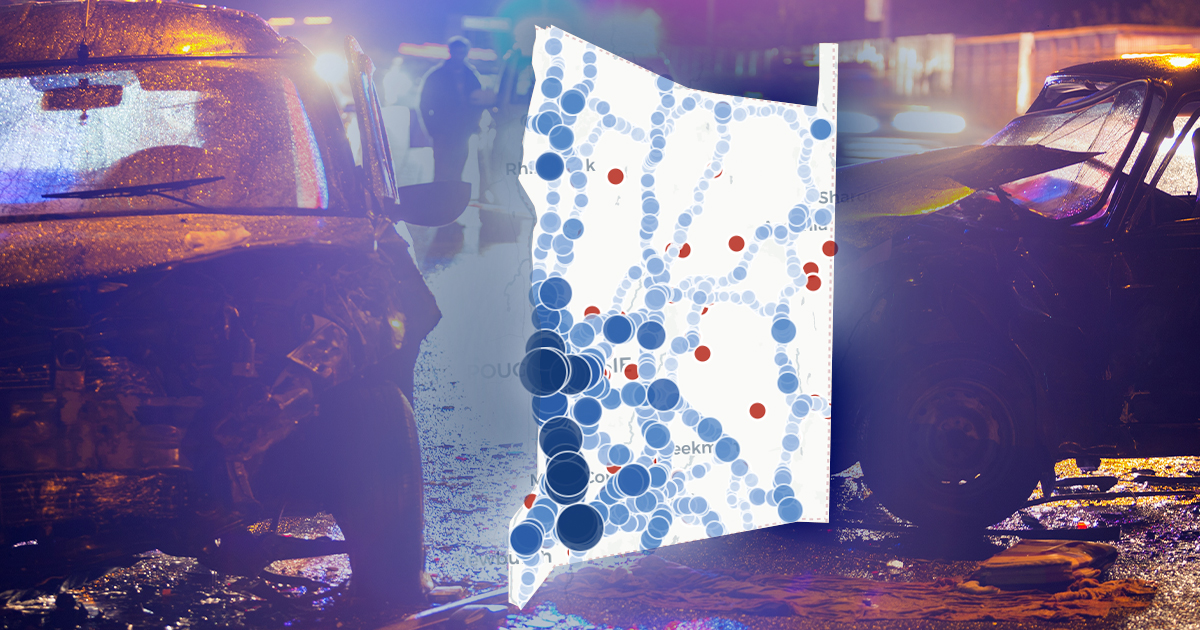
We analyzed every reported motor vehicle crash in Dutchess County from 2021 through 2024 — 29,493 crashes — using New York State’s official crash records. Unlike our regional highway map, these county-wide figures cover every road: state highways, the Thruway, and county, town, and city streets. The headline isn’t the volume. It’s the direction.
Fatal crashes are up 65% — the region’s most alarming trend
Dutchess County averaged 1,580 injury crashes per year — more than four every day. But the number that stands out: fatal crashes rose from 20 in 2021 to 33 in 2024, a 65% increase and the sharpest deterioration in the Hudson Valley.
| Year | Total crashes | Injury crashes | Fatal crashes | Injury rate |
|---|---|---|---|---|
| 2021 | 6,883 | 1,516 | 20 | 22.0% |
| 2022 | 7,688 | 1,590 | 24 | 20.7% |
| 2023 | 7,298 | 1,562 | 26 | 21.4% |
| 2024 | 7,624 | 1,651 | 33 | 21.7% |
Fatalities have climbed every single year in the records. Injury crashes rose 8.9% over the same period.
How Dutchess compares to its neighbors
| County | Injury crashes/yr | Fatal crashes/yr | Injury rate |
|---|---|---|---|
| Orange | 2,446 | 33 | 21.8% |
| Dutchess | 1,580 | 26 | 21.4% |
| Ulster | 894 | 15–16 | 17.9% |
More than one in five Dutchess crashes injures someone — nearly identical to Orange, on two-thirds the traffic.
How badly people were hurt in 2024
The Institute for Traffic Safety Management & Research (ITSMR) compiles the same police reports on an earlier, preliminary schedule, and counts 1,664 injury crashes in 2024 against the state case file’s 1,651. Those crashes hurt or killed 2,305 people: 1,612 drivers, 543 passengers, 86 pedestrians, 58 bicyclists and 6 listed as unknown. Among the injured, 248 injuries were classed as serious, 264 as moderate and 1,017 as minor.
“Serious” means life-threatening: long hospital stays, surgery, months out of work. Those are the cases where New York’s $50,000 no-fault cap runs out fast. Passengers are worth a note of their own — 543 of the people hurt were passengers, and a passenger is almost never the one at fault.
The crashes that injure people here
Among crashes with an identified collision type (2021–2024):
| Collision type | Crashes | Why it matters |
|---|---|---|
| Rear-end | 6,737 | 23% of all crashes — the highest rear-end share in the region. Congested commercial corridors like Routes 9 and 44/55 |
| Overtaking | 3,704 | Passing maneuvers |
| Right angle | 3,276 | Intersection crashes — someone ran a light or stop sign |
| Left turn | 1,250 | Turning across oncoming traffic |
| Head-on | ~470 | The rarest — and the most severe |
Dutchess leads the region in rear-end share — the signature crash of stop-and-go arterial traffic, and the collision type where fault is usually clearest. If you’ve been hit on one of these corridors, a Poughkeepsie car accident lawyer can tell you quickly whether you have a claim.
What caused them
Police also record a contributing factor. In 2024 the leading causes of injury crashes in Dutchess County were failure to yield the right of way (351 crashes), following too closely (343), unsafe speed (312) and driver inattention or distraction (296). Fatal crashes told a different story: unsafe speed (10), pedestrian or bicyclist error or confusion (9), improper passing or lane use (8) and illegal drugs (3). Speed is the thread running through the county’s deadliest crashes. Source: ITSMR, 2024 preliminary.
A third of injury crashes involve only one vehicle
In 2024, 548 of the county’s 1,664 injury crashes involved a single vehicle; 1,116 involved two or more. A one-car crash does not mean you have no claim. Your own no-fault coverage pays medical bills and lost wages up to $50,000 regardless of fault. Beyond that, someone else may still be responsible: a municipality or contractor for a road defect, a manufacturer for a vehicle defect, an employer if you were driving a company vehicle, or the driver if you were a passenger.
The roads where Dutchess County crashes happen
In Dutchess County, the road data has one overwhelming headline: US 9. The Route 9 corridor logged 4,383 crashes in four years — more than the #2 and #3 corridors combined — plus 954 injury crashes and 17 fatal ones on the state data alone. Federal records make it the county’s deadliest road outright, with 13 fatal crashes. The Taconic State Parkway, often assumed to be the county’s danger spot, ranks third — real, but half of Route 9’s problem.
| Corridor | Crashes (2021–24) | Injury | Fatal |
|---|---|---|---|
| US 9 | 4,383 | 954 | 17 |
| NY 44 | 1,833 | 466 | 8 |
| Taconic State Pkwy | 1,824 | 326 | 6 |
| I-84 | 1,143 | 240 | 2 |
| NY 9D | 986 | 269 | 6 |
| NY 9G | 980 | 241 | 7 |
| NY 55 | 901 | 217 | 8 |
| NY 82 | 803 | 175 | 4 |
Five of the county’s six worst single locations are on US 9:
- US 9 at Merritt Boulevard, Fishkill — 141 crashes and 43 injury crashes, the worst injury location in the entire Hudson Valley.
- US 9 at Routes 44/55 (Church Street), Poughkeepsie — 101 crashes.
- US 9 at Myers Corners Road, Wappinger — 83 crashes.
- US 9 near Old Post Road, Wappinger — 81 crashes, including 2 fatal.
- US 9 at Spring Road (South Road), Poughkeepsie — 80 crashes.
- The Route 44 arterial at Columbus Drive, Poughkeepsie — 79 crashes, 23 injury — the one non-Route-9 entry, on the corridor we covered in our Route 9 & 44/55 redesign post.
By municipality, the Poughkeepsie area leads with 4,353 state-highway crashes over four years, followed by Fishkill (2,155) and East Fishkill (2,043) — the Route 9 spine, top to bottom. Federal records add what the state data can’t see: 103 fatal crashes (107 deaths) on Dutchess roads of every type, including 6 on NY 55, 5 on NY 9D, and 4 on Violet Avenue (9G) alone. Explore every location on our regional dangerous-highways map, or filtered to Dutchess below.
Injury crashes by town, all roads (2024)
| Rank | Municipality | Injury crashes | Fatal crashes |
|---|---|---|---|
| 1 | Town of Poughkeepsie | 280 | 4 |
| 2 | City of Poughkeepsie | 252 | 2 |
| 3 | Town of Fishkill | 163 | 3 |
| 4 | Town of East Fishkill | 156 | 2 |
| 5 | Town of Wappinger | 122 | 5 |
| 6 | Town of LaGrange | 112 | 4 |
| 7 | Town of Hyde Park | 75 | 3 |
| 8 | Town of Pleasant Valley | 52 | 3 |
| 9 | Town of Rhinebeck | 52 | 0 |
| 10 | Town of Beekman | 37 | 0 |
The state-highway counts above and this all-roads list tell the same story: the two Poughkeepsies, Fishkill, East Fishkill and Wappinger — the Route 9 spine — account for more than half the county’s injury crashes. Wappinger stands out for a different reason: 5 fatal crashes on 122 injury crashes, the worst ratio in the top ten. Fatal counts in this table come from ITSMR’s preliminary file, which records 26 fatal crashes countywide for 2024; the state case file used elsewhere on this page records 33. Source: Institute for Traffic Safety Management & Research, 2024 preliminary.
When crashes happen in Dutchess County
- 69% of crashes happen in daylight — the highest daylight share of the three counties. Distraction, not darkness.
- 13% happen on dark, unlighted roads — the lowest of the three, consistent with Dutchess’s more suburban road network.
- Friday is the most dangerous day (4,910 crashes over four years); Sunday is the safest (3,182).
Pedestrians and cyclists: about 124 crashes a year
Dutchess averaged 124 pedestrian or bicyclist crashes per year. The most common scenarios: crossing without a signal or crosswalk (126 over four years), walking or riding along the highway with traffic (83), and crossing in a marked crosswalk without a signal (58) — being in the crosswalk didn’t protect them.
What most people don’t know: New York’s no-fault insurance covers pedestrians and cyclists hit by a vehicle — the driver’s insurance pays medical bills and lost wages even before fault is decided. Our Poughkeepsie pedestrian accident lawyers handle these cases regularly.
What to do after a crash in Dutchess County
- Call 911 and get the police report number.
- Get medical attention the same day — no-fault benefits require prompt treatment records.
- Photograph vehicles, road conditions, and lighting before anything moves.
- Don’t give a recorded statement to the other driver’s insurer.
- Talk to a local lawyer before accepting any offer. Free consultation: 845-600-0000.
Mainetti & Mainetti in Dutchess County
The firm has tried and settled injury cases in the Poughkeepsie courthouse for decades, with an office at 9 Mansion Street in Poughkeepsie. Results include a $275,000 recovery in a Dutchess County hotel slip-and-fall — see our verdicts and settlements. For a deeper look at how injury cases actually move through the county’s courts, see what Dutchess County court records show.
Frequently asked questions
How many car accidents happen in Dutchess County each year?
About 7,400 reported crashes per year, roughly 1,580 of which injure someone (2021–2024 average, NY State crash records).
Are fatal crashes increasing in Dutchess County?
Yes — sharply. Fatal crashes rose every year from 2021 (20) to 2024 (33), a 65% increase and the worst trend in the Hudson Valley.
What’s the most common type of car accident in Dutchess County?
Rear-end collisions — 6,737 over four years, 23% of all crashes, the highest share in the region.
If you or someone you love was injured in a crash anywhere in Dutchess County, call 845-600-0000 for a free consultation at our Poughkeepsie office. No fee unless we win.
Sources: New York State Open Data, “Motor Vehicle Crashes — Case Information” (2021–2024), our own analysis. County-wide figures cover all roads; the map’s crash-density layer covers state highways (New York publishes no location data for local roads). Figures describe reported crashes and make no claim about fault.